Let’s take a look at the projected completion rates for those commencing their VET studies in 2017.
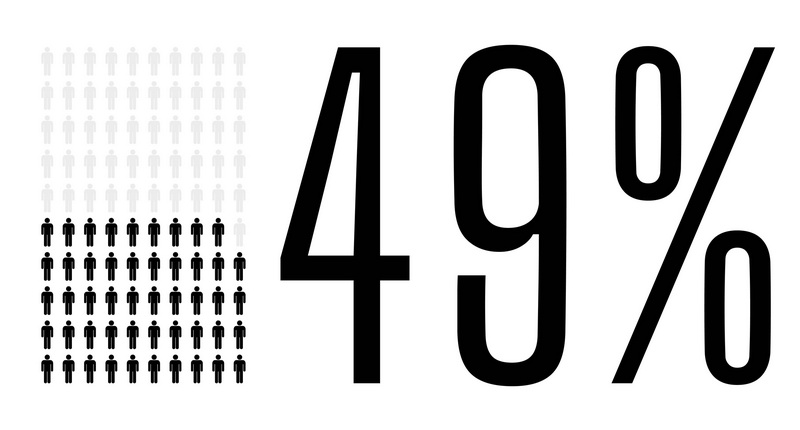
Overall, the completion rate is about 49%, but it does vary. The good news is that projected completion rates have been increasing over time.
Taking a look at the rates
The NCVER report, VET qualification completion rates 2017 was released in 2019. OK, it’s taken us a while to get to it, but a lot has been happening elsewhere in VET as you all know!
What this publication tells us is that 2017 projected completion rates for Training Package qualifications overall is around 50% while those for accredited program are just over 40%. In terms of completion rates for qualification types the rule is the higher you go, the better the rate: around 31% for Cert Is, 44.5% for Cert IIs, 48.6% for Cert IIIs, and 56% and 59% for Cert IVs and Diploma and above respectively.
Importantly, we need to remember that vocational qualification outcomes tend to kick in at Cert III, and that lower level qualifications have a variety of purposes and benefits, and so non-completion may not be a bad outcome necessarily.
In terms of states, the good performer is Tasmania (way out in front at 57%), with others, in order: NSW (52.5%), WA (51%), the ACT (49.2%), Queensland (48.3%), Victoria and SA almost tied (44.6% and 44.4% respectively) with the Northern Territory at 42.7%. Offshore, the projected completion rate is north of 74%!
It varies by provider type too. The highest projected completion rates are at enterprise providers and schools (at around 60% and 55% respectively). The next best are private providers (50.7%), universities (48.1%), community education providers (47.4%), and finally TAFEs (43.6%).
Funding source is an issue too, with the highest rate of projected completions for international fee-for-service (at 70%), followed by Government funding (50%) and domestic fee-for-service (at around 43%). So, the issue is always the VET hoary chestnut of: Are they completing a qualification they really need or a set of units or skill sets they actually really want? This gets to the perennial question of the design of qualifications, Training Packages, skill sets, and micro credentials.
Looking at trends
The paper shows the trend in projected completion rates from 2015, 2016 and 2017. For Training Package completions, it rises from 42% in 2015 to around 50% in 2017. In terms of qualification levels for the same two years, completions rose from 36.5% to 59% for Diplomas or higher; around 47% to 56% for Cert IVs, with smaller rises for Cert IIIs and IIs (44 to around 47% and around 41 to 44.5% respectively). Certificate Is remained static at around the 30% mark.
For states, the really big improvers were Tasmania (around 18 percentage points higher), and NSW and WA (around 12 to 13 percentage points higher) with smaller rises in the other states. Victoria only saw at 3 percentage point rise to 44.6% in 2017.
In terms of provider type, the biggest improvement in projected completion rates was from enterprise providers (around 12%), followed by private providers, community education providers, schools, TAFEs and universities (at around 3.7%).
Finally, there is a data slicer that you may wish to access to delve more deeply into what these data tell you.


